Basic 7
Lesson 1:
Tallies
Lesson 2:
Frequency Tables
Lesson 3:
Pie Chart
Lesson 4:
Double Bar Graphs
Tallies
A tally is a simple way to record and count items, events, or occurrences. It involves drawing marks (or ticks) to represent quantities. Tallies are often grouped in sets of five for easier counting.
Using Tallies
1. Recording Occurrences
∗ Tallies are used to record occurences. Each occurrence is represented by a vertical mark (|).
∗ For every fifth occurrence, draw a diagonal line through the first four vertical marks as shown in the diagram below:

Let's look at the various ways you would show counts using a tally.
Consider the example below:
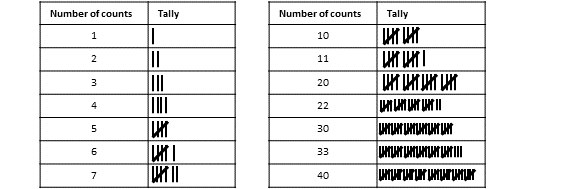
2. Grouping for Easy Counting
∗ Tallies are grouped in sets of five, making it easy to count large numbers quickly by counting groups instead of individual marks.
For instance, in the table above, the tally for 40 is 8 groups of 5 marks each.
Importance of Tallies.
∗ Efficiency:
Tallies are a quick and simple way to record data in real-time.
∗ Clarity:
Grouping tallies in sets of five makes counting faster and reduces errors.
∗ Versatility:
They can be used in various contexts, such as surveys, inventory checks, or keeping scores in games.
Example of Using Tallies
Imagine you are counting the number of cars passing by a street during a specific time. Using tallies your result might look like this:
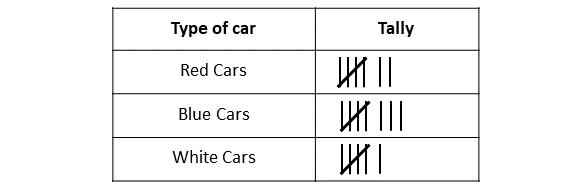
Interpreting the Tallies
Red cars: 7
Blue cars: 8
White cars: 6
We will use our knowlegde of tallies to collect and organise data into frequency tables in our next lesson.